 |
| Source: Behaviorgap.com |
"When comes to technical analysis, trading or walking through your life as a whole. Simpler is always better. Don't you agree?"
However, we as human already trained that the solution to an important problem has to be complex. Logically we know that complexity isn't a guarantee, but it seems to make people happy.
If the fanciest, colorful and expensive indicators won't guarantee your success in trading. What does?
It is the understanding that we can't control the market therefore, the only one we can control is ourselves.
By reading this post you will learn about:
- A simple technical approach which will make you understand the market better
- Read the mood of the market
- Really understand the fundamental trend that the market develops
Let's start with the first two:
EMA 8 and EMA 21 - They Dance with The Market
 |
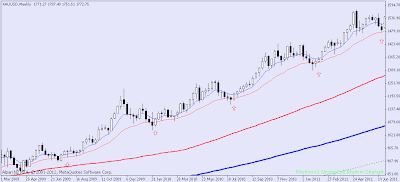
| Gold price (XAU/USD) With EMA 8, EMA 21, SMA 89 and SMA 200 |
All I want you to do right now is to plot 2 exponential moving averages, with the period of 8 and 21.
The best 4 moving averages are: EMA 8, EMA 21, SMA 89 and SMA 200.
8, 21 and 89 are derived from the fibonacci sequence. While the 200 day moving average already well known as the golden moving average.
Back to the chart, you should see 2 thin red and blue line. The blue line is the EMA 8, and the thin red line is the EMA 21.
As you can see, the EMAs dances with the price. Its reflected the movements of the price almost perfectly. The rule of thumb is this, when the price is above the EMAs then we can say that the trend is up, of course with a series of pullbacks (the red arrow). Vice versa.

Right at this point you should ask yourself:
- How do I know that the price will continue to go up?
- Is it necessarily to go long or short depending on the position of the price against the two EMAs?
The answer is this: Understand that the EMA 21 is the decision making moving averages.
As long the EMA 21 (thin red line) is able to support or resist the price movement, then the market reversal is less likely and the trend will prevail.
After understanding how the EMA 8 and 21 works together you should be able to:
- Spot highly potential trend reversal
- Figuring out whether the market will continue the trend
- See that a pullback is coming
Trading can be so simple yet profitable.
You should try it yourself. I will post about the next best 2 moving indicators later on
You should try it yourself. I will post about the next best 2 moving indicators later on
The Four Best Moving Averages: Part 2 - Understand the Fundamental Mood of The Market


